Copyright © 2026 Bill Yen.
QIIME 2 Output Cleaner
A Bioinformatics Visualization Tool
About:
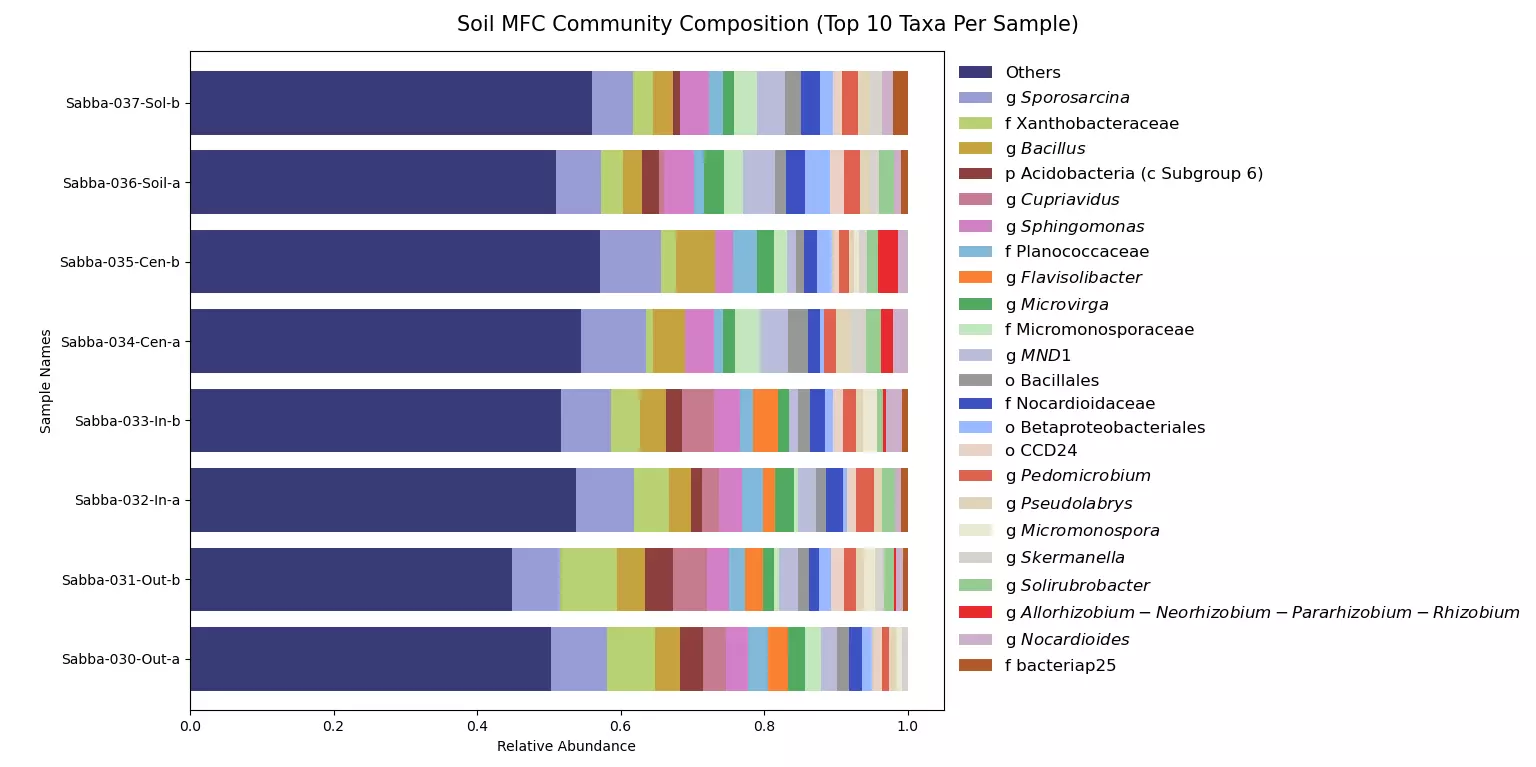
While working as a Research Assistant in the Wells Environmental Biotechnology Lab to characterize the microbial communities in different bio-electrochemical systems, I noticed that there was no built-in way to produce good community composition plots using the output data from QIIME 2, a popular bioinformatics package. Because each sample can contain thousands of different microbes, it is very useful to be able to display just the most common taxa in each sample and compare them. My program lets users create cleanly formatted community composition graphs using the collapsed feature table TSV output from QIIME 2. QIIME 2 Output Cleaner is GUI-based and allows the user to select for as many top taxa per sample as they want in their graph without having to code, and it also outputs a CSV file that the user can export to other programs like R or Excel.