Copyright © 2026 Bill Yen.
Heat Island Effect in Chicago
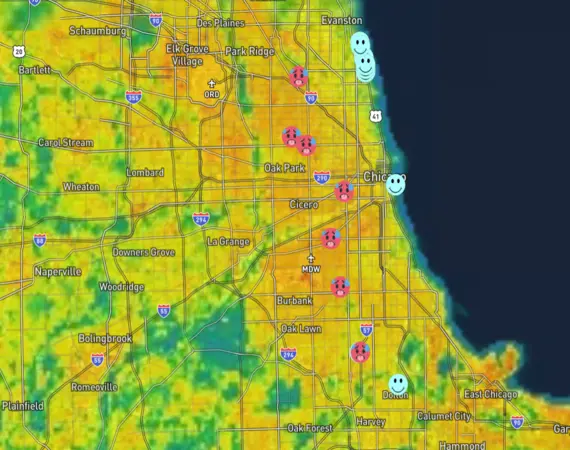
Interactive Map of Chicago's Land Surface Temperatures
About:
I created an interactive web map of the heat island effect in Chicago during a hot summer day in August within just 24 hours as a part of the GIS hackathon hosted by Earth Hacks, NASA Jet Propulsion Laboratory, and Urban Canopy. This project gave me practical experience with building web applications and leveraging Geographical Information System (GIS) to visualize data. The time constraint also honed my ability to work on the go and think flexibly in a stressful situation.